Future Facilities partners with Rescale to deliver high performance #datacenter #digitaltwin modeling

High performance computing now available through cloud bursting to 6SigmaET and 6SigmaDCX customers around the world

FFRES

Register for the webcast > Register Here

Future Facilities today announces a new partnership with Rescale, a cloud-based simulation platform provider. The relationship will allow facility managers, architects and designers from across the globe to perform the most complex data center modelling quickly, using high performance computing (HPC) in the cloud to keep up with increasing demand for fast and accurate results from the enterprise.

The partnership will allow customers of Future Facilities’ best-in-class 6SigmaET and 6SigmaDCX computational fluid dynamics (CFD) software to access Rescale’s HPC capabilities. When on premise IT infrastructure is already utilized or incapable of dealing with the size of model, cloud overflow will deliver instant, scalable and secure compute resource. In addition, customers can choose to use Rescale’s cloud exclusively for solving by storing their solver license with Rescale and then purchasing hardware time on-demand removing the high initial costs of on-site hardware.

Jonathan Leppard, Director at Future Facilities said: “The rapidly growing number of electronic devices known as the internet-of-things is leading to an explosive growth in demand for back-end computing resources. Equally, data centers are only getting larger and more complex to meet the ever-growing demand for compute power from enterprise applications. In order to run these large and complex data centers efficiently, our 6SigmaET and 6SigmaDCX suites are vital to truly understand the complex thermal environments inside data centers and electronics.”

He continued: “There is a constant battle between accuracy and speed of results, with some simple tools on the market sacrificing accuracy for faster results – a bad compromise when you consider the critical importance of these environments. Our partnership with Rescale now allows organizations to have the best of both worlds: true CFD modelling that takes advantage of unlimited compute resource allowing for accuracy as well as quick turnaround”.

6SigmaET-768x638

Joris Poort , CEO at Rescale said: “Complex simulations have high computing requirements – however this scale of compute demand is usually not needed outside of these simulation scenarios. Through our partnership with Future Facilities, many more organizations can now use our world-class secured compute capabilities when they are needed. We look forward to helping enable the next generation of devices and data centers come to life with Future Facilities.”

DCX_Monitor_EmailResolution-768x637

Posted in Data Center DCIM Datacenter Datacenters Datacentre | Tagged , , , , , , | Leave a comment

Airline Networks: from hub-and-spoke to point-to-point networks

Source: Airline Networks: from hub-and-spoke to point-to-point networks

Posted in Data Center DCIM Datacenter Datacenters Datacentre | Tagged , , | 1 Comment

3 Ways #DataCenters Can Use #CFD Modeling Right Now

Originally posted on the Belden Blog

You may have heard about computational fluid dynamics (CFD) modeling when it comes to the design of high-performance Formula 1 racecars. By using CFD modeling to maximize down-flow forces while minimizing friction – for the racecar body and smaller “wings and struts” – Formula 1 produces a winning combination.

In a similar manner, CFD can be used in today’s data centers during design, capacity planning, troubleshooting and day-to-day operations. It can be used to properly develop the best design and operations solutions throughout the entire data center ecosystem, from the micro environment (chips) to enclosure environments (cabinets and containment) to the macro environment (computer white space and the entire data center hall).

Here are three ways that your data center ecosystem can benefit from CFD.

6sigmaFM_blog-1

1. Server Design and CFD Modeling

High-efficiency server manufacturers are pushing the limit on power efficiency and thermal boundaries. They use CFD modeling to optimize power and thermal characteristics.

A typical high-performance server is made up of precisely located components to optimize performance and efficiency: CPU, motherboard, power supply, CPU, storage, drives, fans, heat sinks and other components. To assist the design engineer in arranging these components to meet design objectives and maximize power and thermal goals, CFD modeling is used.

It provides a tool to virtually test a server in different configurations, taking into account different enclosure and cooling configurations, such as cold-aisle containment, hot-aisle containment, overhead supply, underfloor supply and rack-centered cooling solutions.

This technology can fine tune thermal characteristics of a server and provide a more accurate power/thermal baseline. Data center designers then use this information to develop the most efficient data center cooling solution possible.

Today’s CFD analysis tools can also coordinate the server, rack and data center hall to take full advantage of accurate server data to develop precise, energy-efficient enclosure/containment and high-performance cooling solutions.

CFD modeling can be used by design teams to test innovative cooling strategies as well. For example, it helps them better understand how liquid cooling technologies and cold plate options impact server performance.

2. Enclosure Design and CFD Modeling

Today, optimized enclosure solutions are necessary to accommodate growth in data center capacity and increased power density due to the explosion of cloud solutions and the escalation of IoT and AI.

CFD analysis provides flexibility for data center design teams to swap server models (and associated CFD results data) so they can simulate the answers to certain questions. For example, CFD analysis tells you whether a cabinet can respond to a swing in equipment power density from 5 kW to 15 kW.

Compared to designers having to use nameplate data or a “black box,” accurate results from CFD models of server equipment give designers the best data foundation possible to virtually push the capacity limits of an enclosure to obtain more capacity while following thermal guidelines from SLAs and ASHRAE.

Watch the video below:

3. Facility Design and CFD Modeling

Data center facilities engineering teams responsible for developing mechanical cooling strategies can benefit significantly from incorporating server and enclosure CFD modeling results into a CFD model of the data center hall.

Accurate temperature, pressure and airflow results from server and enclosure models can be used to develop a fine-tuned mechanical system design strategy (from chiller plant, pump selection and piping/valve selections to CRAC size and number, ductwork size, raised floor depth and control) that is correctly sized to accommodate Day 1 and Day 2 server loads.

A right-sized mechanical system offers several benefits:

This results in enhanced server SLA compliance, reduced hotspots and a more efficient server.

How Belden Uses CFD

Belden uses CFD modeling to assist data center design professionals, managers and operators in designing efficient technology solutions for new and legacy data center environments.

CFD analysis provides predictive results that bridge high-performance computer server operations with the rack enclosure, and with the critical mechanical system.

Just as a fine-tuned Formula 1 racecar relies on highly trained engineers to develop the most efficient racecar possible, today’s high-performance data center operators can rely on Belden to do just the same: use highly trained engineers to develop an efficient solution that reduces costs, ensures uptime, maximizes space and saves times. Learn more here.

Posted in Data Center DCIM Datacenter Datacenters Datacentre | Tagged , , , | 2 Comments

Science could make fire suppression safe via #datacenter #simulation

Data centers have had a problem with fire suppression systems. While trying to remove the threat of fire damage, they have actually introduced dangers of their own.

These systems operate by flooding the data center with inert gas, preventing fire from taking hold. However, to do this, they have to fill the space quickly, and this rapid expansion can create a shockwave, with vibrations that can damage the hard drives in the facility’s storage systems.

data-center-fire-dangers

Image from: greenhousedata.com

A year ago, this happened in Glasgow, where a fire suppression system took out the local government’s email systems. And in September ING Bank in Romania was taken offline by a similar system. At the bank, there wasn’t even a fire. The system wrecked hard drives during a planned test of the fire suppressions system – one which had been unwisely scheduled for a busy lunchtime period.

These are just the incidents we know about. Ed Ansett of i3 has told us that this same problem has occurred on many occasions, but the data centers affected have chosen not to share the information.

It’s also likely these faults will happen more frequently as time passes because hard drives are evolving. To make higher capacity drives, vendors are allowing read/write heads to fly closer to the platters. This means they can resolve smaller magnetic domains, and more bits can fit on a disk. These drives have a smaller tolerance to shaking.

This is a shame because information leads to understanding, which is the key to solving the problem. To solve the problem, we need a scientific examination of how these incidents occur. And it turns out this is exactly what has been happening.

At DCD’s Zettastructure event in London last week, I heard about two very promising lines of inquiry that could make this problem simply disappear.

Fire suppression vendor Tyco believes that with drives becoming more fragile, more gentle nozzles are needed. The company has created a nozzle which will not shake drives, and will eventually be available as an upgrade to existing systems. Product manager Miguel Coll told me that the new nozzle is just as effective in suppressing fires, but does not produce a damaging shockwave.

That sounds like a problem solved – but there’s another approach. Future Facilities is well known for its computational fluid dynamics (CFD) software, which models the flow of air in data centers and is usually used to ensure that hot air is removed efficiently and eddies don’t waste energy.

Future Facilities checked the physics and found its software could also model the flow of much faster air, including the shockwave produced when a fire suppression system floods the room with gas.

The company modeled the operation of the systems and found that the nozzles are usually placed too close to IT systems. The rules by which they are placed were set by authorities outside the data center industry and predate today’s IT systems.

Future Facilities product manager David King reckons the research means that the whole problem can be avoided by simply placing the nozzles according to CFD models of how they work.

The data center industry’s weapon in the war on risk and waste is science. I’ll publish more about this on DatacenterDynamics, while the agenda of the Zettastructure event is online and the presentations will be available.

Peter Judge is editor of DatacenterDynamics


Previously seen on Green Data Center News

Posted in Data Center DCIM Datacenter Datacenters Datacentre | Tagged , , , , , | Leave a comment

#Datacenter Operational Planning with #Engineering #Simulation

es2v3

In this third and final video of the series, we discuss the importance of ongoing Operational Planning on the thermal performance of your facility, and how engineering simulation can help you mitigate risk to your data center’s IT equipment.

Posted in Data Center DCIM Datacenter Datacenters Datacentre | Tagged , , , , , | Leave a comment

10 Most Connected #DataCenters

ES2

Read the full article on Data Cneter Knowledge click here

Here are the top 10 most connected data centers, according to Cloudscene:

1. SG1

Operator: Equinix
Location: Singapore
Number of service providers: 312

Directory Equinix SG1

2. LA1

Operator: CoreSite
Location: Los Angeles (One Wilshire)
Number of service providers: 259

directory la1 coresite

3. FR5

Operator: Equinix
Location: Frankfurt
Number of service providers: 246

directory equinix fr5

4. Denver

Operator: 910Telecom
Location: Denver
Number of service providers: 203

directory 910telecom denver

5. Telehouse North

Operator: Telehouse (subsidiary of KDDI)
Location: London
Number of service providers: 197

directory telehouse north

6. SY3

Operator: Equinix
Location: Sydney
Number of service providers: 187

directory equinix sy3

7. SY1

Operator: Equinix
Location: Sydney
Number of service providers: 184

directory equinix sy1 sydney campus

8. Paris Voltaire

Operator: Telehouse
Location: Paris
Number of service providers: 155

directory telehouse paris voltaire

9. DC2

Operator: Equinix
Location: Ashburn
Number of service providers: 155

directory equinix dc2

10. HK1

Operator: Equinix
Location: Hong Kong
Number of service providers: 151

directory equinix hk1

All images taken from websites of the data center providers on this list.

Posted in Data Center DCIM Datacenter Datacenters Datacentre | Tagged , , | 2 Comments

How to succeed with The Performance Indicator #datacenter #datacentre @TheGreenGrid @6SigmaDC

DCDNews

*Press Release on Data Center Knowledge: Performance Indicator, Green Grid’s New Data Center Metric, Explained

To find out more about The Performance Indicator visit thegreengrid.org

Posted in Data Center DCIM Datacenter Datacenters Datacentre | Tagged , , , , | 1 Comment

@TheGreenGrid New #DataCenter Metric – Performance Indicator – Explained

The Green Grid Association is a non-profit, open industry consortium that works to improve the resource efficiency of information technology and data centers throughout the world. (PRNewsFoto/The Green Grid Association)

The Green Grid Association is a non-profit, open industry consortium that works to improve the resource efficiency of information technology and data centers throughout the world. 

The Green Grid published PUE in 2007. Since then, the metric has become widely used in the data center industry. Not only is it a straightforward way to take a pulse of a data center’s electrical & mechanical infrastructure efficiency, but it is also a way to communicate how efficient or inefficient that infrastructure is to people who aren’t data center experts.

Building on PUE with Two More Dimensions

Performance Indicator builds on PUE, using a version of it, but also adds two other dimensions to infrastructure efficiency, measuring how well a data center’s cooling system does its job under normal circumstances and how well it is designed to withstand failure.

Unlike PUE, which focuses on both cooling and electrical infrastructure, PI is focused on cooling. The Green Grid’s aim in creating it was to address the fact that efficiency isn’t the only thing data center operators are concerned with. Efficiency is important to them, but so are performance of their cooling systems and their resiliency.

All three – efficiency, performance, and resiliency – are inextricably linked. You can improve one to the detriment of the other two.

By raising the temperature on the data center floor, for example, you can get better energy efficiency by reducing the amount of cold air your air conditioning system is supplying, but raise it too much, and some IT equipment may fail. Similarly, you can make a system more resilient by increasing redundancy, but increasing redundancy often has negative effect on efficiency, since you now have more equipment that needs to be powered and more opportunity for electrical losses. At the same time, more equipment means more potential points of failure, which is bad for resilience.

Different businesses value these three performance characteristics differently, Mark Seymour, CTO of Future Facilities and one of the PI metric’s lead creators, says. It may not be a big deal for Google or Facebook if one or two servers in a cluster go down, for example, and they may choose not to sacrifice an entire multi-megawatt facility’s energy efficiency to make sure that doesn’t happen. If you’re a high-frequency trader, however, a failed server may mean missing out on a lucrative trade, and you’d rather tolerate an extra degree of inefficiency than let something like that happen.

PI measures where your data center is on all three of these parameters and, crucially, how a change in one will affect the two others. This is another crucial difference from PUE: PI, used to its full potential, has a predictive quality PUE does not.

It is three numbers instead of one, making PI not quite as simple as PUE, but Seymour says not to worry: “It’s three numbers, but they’re all pretty simple.”

The Holy Trinity of Data Center Metrics

The three dimensions of PI are PUE ratio, or PUEr, IT Thermal Conformance, and IT Thermal Resilience. Their relationship is visualized as a triangle on a three-axis diagram:

TGG Triangle Vectorized-01 (3)

Example visualization of Performance Indicator for a data center (Courtesy of The Green Grid)

PUEr is a way to express how far your data center is from your target PUE. The Green Grid defines seven PUE ranges, from A to G, each representing a different level of efficiency. A, the most efficient range, is 1.15 to 1.00, while G, the least efficient one, ranges from 4.20 to 3.20.

Every data center falls into one of the seven categories, and your PUEr shows how far you currently are from the lower end of your target range (remember, lower PUE means higher efficiency).

So, if your facility’s current PUE is 1.5, which places you into category C (1.63 – 1.35), and your target is to be at the top of C, you would divide 1.35 by 1.5 and get a PUEr of 90% as a result. You do have to specify the category you’re in, however, so the correct way to express it would be PUEr(C)=90%.

IT Thermal Conformance is simply the proportion of IT equipment that is operating inside ASHRAE’s recommended inlet-air temperature ranges. In other words, it shows you how well your cooling system is doing what it’s designed to do. To find it, divide the amount of equipment that’s within the ranges by the total amount of equipment, Seymour explains.

The Green Grid chose to use ASHRAE’s recommendations, but data center operators may choose to determine themselves what temperature ranges are acceptable to them or use manufacturer-specified thermal limits without degrading the metric’s usefulness, he adds.

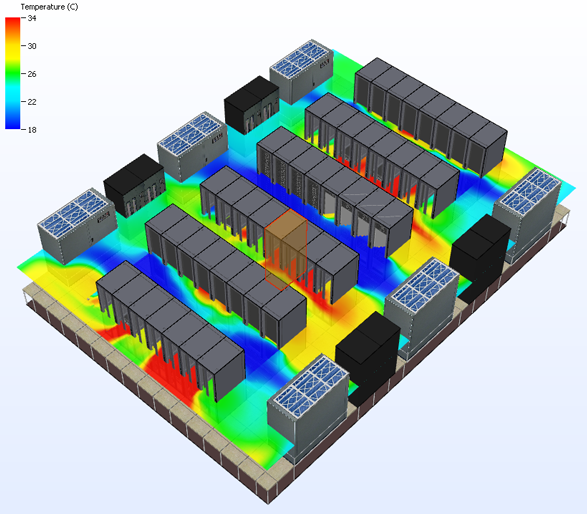
IT Thermal Resilience shows how much IT equipment is receiving cool air within ASHRAE’s allowable or recommended temperature ranges when redundant cooling units are not operating, either because of a malfunction or because of scheduled maintenance. In other words, if instead of 2N or N+1, you’re left only with N, how likely are you to suffer an outage?

This is calculated the same way IT Thermal Conformance is calculated, only the calculation is done while the redundant cooling units are off-line. Of course, The Green Grid would never tell you to intentionally turn off redundant cooling units. Instead, they recommend that this measurement be taken either when the units are down for maintenance, or, better yet, that you use modeling software to simulate the conditions.

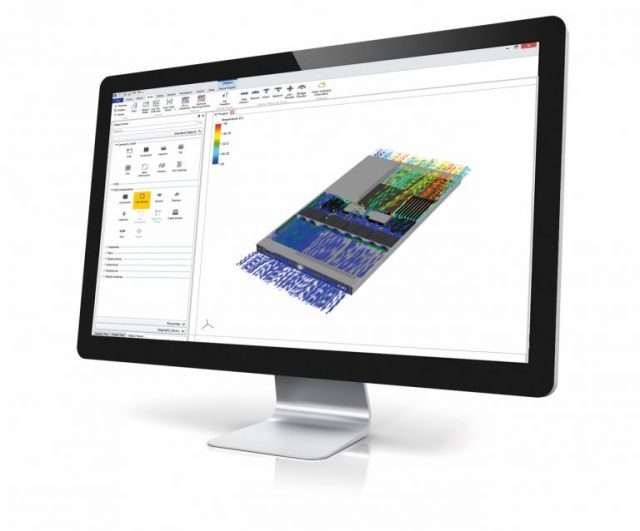
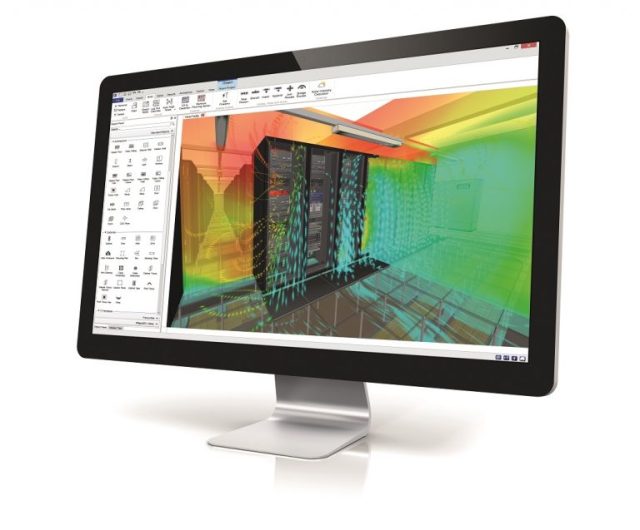
Modeling Makes PI Much More Useful

Modeling software with simulation capabilities used in combination with PI can be a powerful tool for making decisions about changes in your data center. You can see how adding more servers will affect efficiency, resiliency, and cooling capacity in your facility, for example.

This is where it’s important to note that Future Facilities is a vendor of modeling software for data centers. But Seymour says that about 50 members of The Green Grid from many different companies, including Teradata, IBM, Schneider Electric, and Siemens, participated in the metric’s development, implying that the process wasn’t influenced by a single vendor’s commercial interest.

Four Levels of Performance Indicator

The Green Grid describes four levels of PI assessment, ranging from least to most precise. Not every data center is instrumented with temperature sensors at every server, and Level 1 is an entry-level assessment, based on rack-level temperature measurements. ASHRAE recommends taking temperature readings at three points per rack, which would work well for a Level 1 PI assessment, Seymour explains.

Level 2 is also based on measurements, but it requires measurements at every server. To get this level of assessment, a data center has to be instrumented with server-level sensors and DCIM software or some other kind of monitoring system.

If you want to get into predictive modeling, welcome to PI Level 3. This is where you make a PI assessment based on rack-level temperature readings, but you use them to create a model, which enables you to simulate future states and get an idea of how the system may behave if you make various changes. “That gives the opportunity to start making better future plans,” Seymour says.

This is where you can also find out whether your data center can handle the load it’s designed for. Say you’re running at 50% of the data center’s design load, which happens to be 2MW. If you create a model, simulate a full-load scenario, and find that either your IT Thermal Conformance or your IT Thermal Resilience is only what you want it to be at 1.8MW, you’ve wasted your money.

Those are just a couple of possible use cases. There are many more, especially with PILevel 4, which is similar to Level 3 but with a much more precise model. This model is calibrated using temperature readings from as many points on the data center floor as possible: servers, perforated tiles, return-air intake on cooling units, etc. This is about making sure the model truly represents the state of the data center.

Different operators will choose to start at different levels of PI assessment, Seymour says. Which level they choose will depend on their current facility and their business needs. The point of having all four levels to avoid preventing anyone from using the new metric because their facility doesn’t have enough instrumentation or because they haven’t been using monitoring or modeling software.

To find out more about The Performance Indicator visit thegreengrid.org

Originally released on Data Center Knowledge: http://www.datacenterknowledge.com/archives/2016/07/18/performance-indicator-green-grids-new-data-center-metric-explained/

Posted in Data Center DCIM Datacenter Datacenters Datacentre | Tagged , , , , , , , | 1 Comment

#DataCenter Efficiency – Using #CFD Simulation to Optimize Cooling in Design & Operation

6sigmaFM_blog-1

Modern Simulation Software for Data Centers. Source: Future Facilities


Energy is one of the biggest (if not the biggest) cost factors associated with data center operations, and represents the highest year over year growth rate. Unfortunately the efficient use of cooling can be like a game of Tetris. In Tetris, efficient use of space is impacted by the unpredictable shape of the blocks.  In the data center efficient use of cooling is impacted by the unpredictable airflow requirements of the IT equipment.  In Tetris, you can see the blocks and how they use the space.  But how can you do the same for cooling in the data center?

Are you confident the cooling optimization efforts have no negative impact on your data center operation and do not cause problems? Do you know if your current airflow is sufficient for the latest generation of server you plan to install? Can the cooling design for your facility still cope with today’s requirements of high-density deployments?

As today’s facilities have to be efficient and resilient it is a considerable advice to avoid trial and error strategies. State-of-the-art simulation techniques, such as Computational Fluid Dynamics (CFD), make the invisible visible, and validate the impact of IT infrastructure changes before putting them into action. CFD has become an essential tool for many companies as it allows users to quantify the airflow and temperature which would occur if physical alterations were made to the data center space.

Adapting new validation methods

CFD provides the capability to analyze every square inch of the data center, and determine the effectiveness of cooling within the racks and aisles. It also helps consider all the relevant aspects of cooling optimization with monitoring measures to validate simulation and planning results during operation.

The engineering simulation allows you to model any type of data center configuration whether it’s raised floor, slab, overhead cooling, in-row cooling, etc. Modern free-cooling technology can be incorporated such as direct and indirect evaporative cooling. You can even model complete control systems, hot-aisle or cold-aisle containment easily and compare each design variation. The simulation also allows you to analyze the impact of losing power to the entire facility (transient). Using CFD in the design phase is the best practice; today most sites are designed with the help of CFD tools in planning process by contractors. When the site is handed over to the user, CFD is usually no longer used on a regular basis – and that’s exactly where problems start to occur.

That’s why CFD is ideal to maintain to prevent changes for the worse. CFD can be employed when operators wish or need to check for a cooling perspective to make sure every piece of IT equipment is getting sufficient air flow at the right temperature in event of a failure. It has the capability to predict consequences of cooling failure.

Predict before you commit

CFD solves and even prevents many problems in data center design and operations. There are many benefits to CFD as there is no risk as changes are modeled and validated before action is taken. CFD integrates seamlessly into planning workflows and including it in operational procedures is nowadays a must for mature state-of-the-art data center management. Cooling optimization reduces energy costs, allows reclaiming of lost capacity, reduces downtime by preventing hotspots and optimizes space usage.

Modeling CFD allows effective communication between equipment suppliers, data center designers and operators. It is a risk-free way of experimenting within the data center to improve performance and capacity.

Though CFD modeling requires information about the size, content and layout of the data center to create a 3D model. If you are using a DCIM tool, the relevant data is already available at your fingertips and you just need to share it with the CFD tool.

An off-the-shelf adapter is available to connect FNT Command with Future Facilities 6SigmaDCX and share all changes between these tools. Integrating Engineering Simulation 6SigmaDCX with FNT Command IMAC Processes is a simple, 3-step planning process:

  • Run a simulation on your current planning scenario to visualize airflow and temperature
  • Look at the effects of the change that has been proposed
  • Cooling limits per cabinet can be committed back to FNT Command to facilitate further planning using internal threshold checks on the updated values.

Oliver Lindner, Head of Business Line DCIM at FNT, recently wrote an Expert Paper on this topic and explains in detail how to achieve performance improvements both in design and operation phase.

Download the expert paper titled here: Data Center Efficiency: Using CFD to Optimize Cooling in Design and Operation

This post originally appeared on the FNT blog: http://blog.fntsoftware.com/data-center-efficiency-using-cfd-optimize-cooling-design-operation/#more-489

Posted in Data Center DCIM Datacenter Datacenters Datacentre | Tagged , , , , , , , , , | Leave a comment

Airflow Management Can Help #DataCenter Operators Realize Robust Energy Savings

Upsite Technologies’ “4 R’s” Approach to Airflow Management Shown to Lower PUE and Increase Equipment Reliability

Holistic Methodology to Improve Computer Room Airflow Management Can Help Data Center Operators Realize Robust Energy Savings and Improve the Environment, as shown by new CFD Video by Future Facilities

Upsite Technologies, Inc., (Upsite) a leader in data center airflow management solutions, announced today that Computational Fluid Dynamics (CFD) modeling has demonstrated the energy savings outlined by its Video (below) 4 R’s of Airflow Management™ methodology. The company tapped Future Facilities North America (Future Facilities NA), the premier provider of engineering simulation software for data center design and operational planning, to demonstrate the findings through the utilization of its 6SigmaDCX CFD simulation tool.

Upsite’s 4 R’s of Airflow Management provides a guide for implementing changes to optimize cooling and achieve the greatest benefits of airflow management, including a lower Power Usage Effectiveness (PUE) score, reduced energy costs, and increased IT equipment reliability. The 4 R’s methodology details the improvements and best practices made to a data center’s racks, raised floor, rows, and room that will provide these benefits and optimize the cooling infrastructure. 6SigmaDCX was used to model a 4,000 sq. ft. data center and provide engineering simulation to assess the impact of the changes made to these four areas: rack, raised floor, row, and room. The simulation provided valuable information about how problem areas (e.g. hot spots) could be rectified and how capacity and operating cost benefits could be realized after making AFM improvements to each of the 4R’s. The execution of the steps resulted in:

  • Reduction in the maximum IT inlet temperature of 8.4° F
  • Cooling supply temperature increase of 10° F
  • Cooling unit fan speeds reduced by 35% and one cooling unit turned off
  • Partial PUE (pPUE) reduced from 1.54 to 1.34
  • Over $60,000 in annual savings for a 4,000 Sq. Ft. Data Center
  • 15 month ROI

“Given the many solutions available to improve data center airflow, the process of creating an effective airflow management plan can seem overwhelming,” said Lars Strong, Senior Engineer and Company Science Officer of Upsite Technologies. “Our 4 R’s of Airflow Management approach provides a clear strategy to optimize cooling and lower PUE. With the impressive results now demonstrated by CFD modeling, I anticipate that more owners and operators will be utilizing our 4 R’s methodology to accomplish this quickly, efficiently, and with a faster ROI.”


Original posted by BusinessWire

Posted in Data Center DCIM Datacenter Datacenters Datacentre | Tagged , , , , , , , , , | Leave a comment